The way I work
Connecting the dots.
Making it useful.
↗Understand & plan
Controlling, financial reporting, planning and forecasting.
⌘Connect & automate
Python, SQL, data pipelines and LLM orchestration.
◎Explain & enable
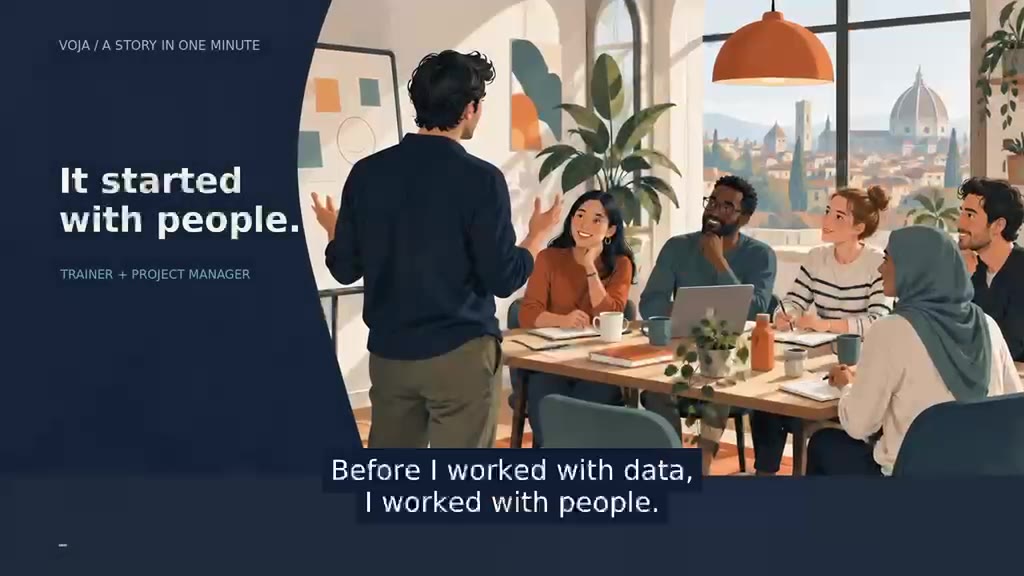
Training, coaching and practical learning experiences.
01 / Selected work
One business.
The whole picture.
Follow a question from the raw data
to a decision you can explain.
o. Orahovo Furniture Group
Sales are growing.
Is profit keeping up?
One fictional business, built to explore a real question. Follow the financial plan, challenge the forecast and understand what moves the result.
Enter the business showcase ↗
ORAHOVO / FINANCIAL OUTLOOKIllustrative preview
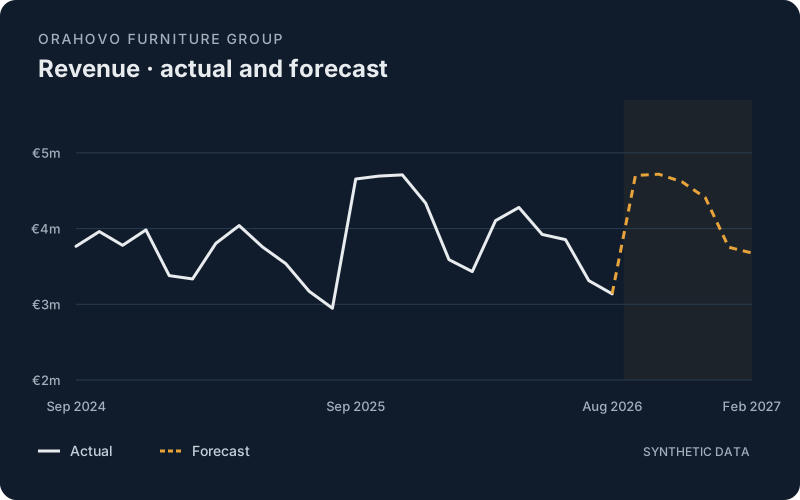 From the demo’s synthetic dataset. Open the showcase for current results.
Historical data Possible futuresExplore the assumptions ↗
Follow the thinking
Every stage connects to the next.
Start with data you can trust.
Follow the raw extracts through cleaning, validation and reconciliation. Every figure has a traceable starting point.
02 / The lab
Ideas you can
get your hands on.
Independent experiments.
Built to be explored, not just described.
03 / The story so far
Different chapters.
A connected perspective.
From international education
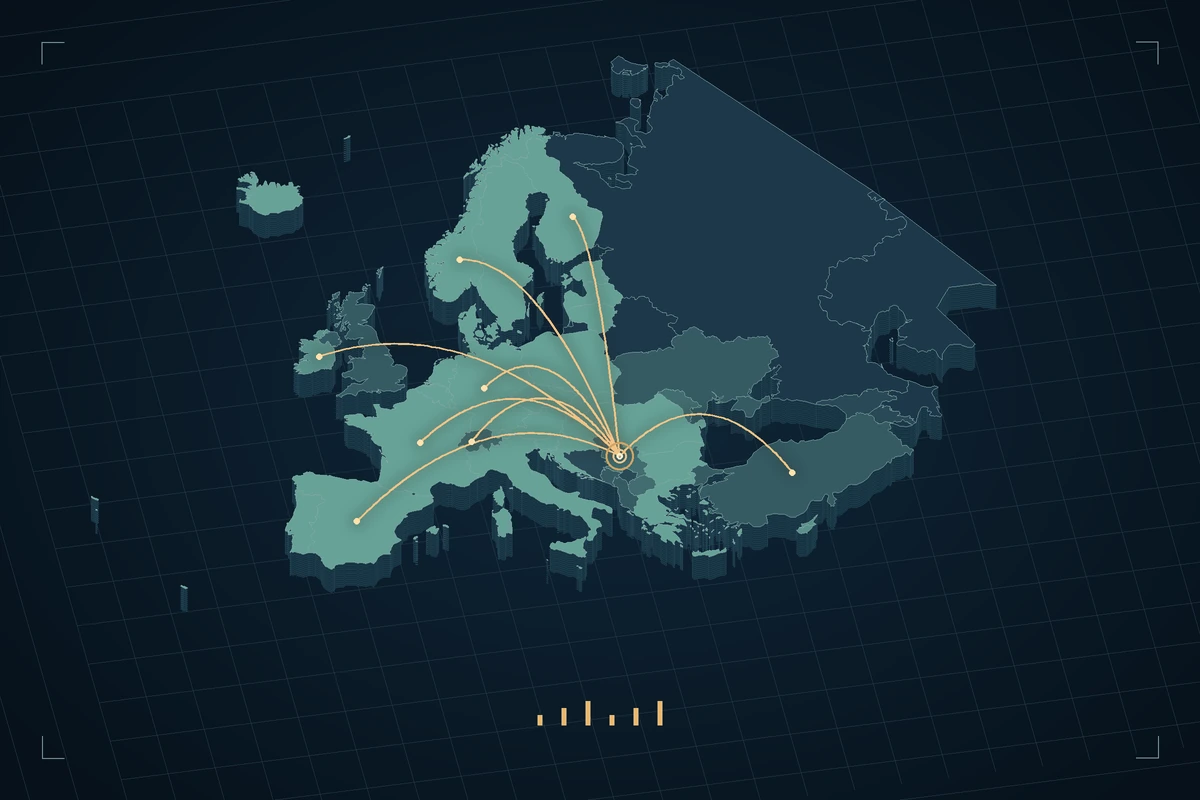
to enterprise data and automation.